Solar panels in Norwich
£3,280 to £10,590 installed, 1,561 hours of sun a year, and 3,323 installations already in the council area.

What a system costs in Norwich
3kWp
£3,280–£4,560
Saves up to £394 a year. Pays back in about 10 years.
4kWp (most common)
£5,370–£6,910
Saves up to £616 a year. Pays back in about 10 years.
6kWp
£7,290–£10,590
Saves up to £898 a year. Pays back in about 10 years.
Source: Home Energy Quotes Cost Index, costs modelled March 2026, savings at the October to December 2026 price cap. Prices are estimates and include installation and VAT. Actual costs may vary.
Norwich in numbers
Published statistics for the Norwich council area, not our estimates.
At the end of 2025 there were 3,323 solar PV installations in the Norwich council area, about 51.6 for every 1,000 households, with 15.4 MW of capacity between them. The count covers every size of installation, on homes and businesses. 44% of homes with an EPC in the Norwich council area are rated D to G, and the median energy score is 70, which is band C.
| Norwich council area | Figure | Source |
|---|---|---|
| Solar PV installations (all sizes) | 3,323 (51.6 per 1,000 households) | DESNZ, end of 2025 |
| Homes with an EPC rated D to G | 44% | ONS, EPCs lodged to March 2025 |
| Median EPC energy score | 70 (band C) | ONS, EPCs lodged to March 2025 |
| Households on mains gas heating only | 75.7% | Census 2021, ONS |
| Warm Homes: Local Grant, 2025 to 2028 | £5,504,964 allocated to Norwich | DESNZ, list updated July 2026 |
| Electricity network operator | UK Power Networks (East England) | NESO licence area boundaries |
Norwich is served by UK Power Networks, the electricity network operator for East England. Solar panels have to be registered with the network operator. Your installer normally does this: smaller systems are notified after installation, and larger ones need approval before work starts.
These are published official statistics for the Norwich council area, which covers Norwich, not Home Energy Quotes estimates. Sources checked 6 October 2026.
Is Norwich a good place for solar panels?
Norwich receives an average of 1561 hours of sunshine per year — slightly above the UK average of 1,493 hours. Combined with East England’s energy prices tracking the UK average, solar panels installations here may offer good value (individual results will vary).
Norwich has a population of 215,000, and the area falls within the East England region. We recommend getting at least 3 quotes to compare prices.

Find Installers in Norwich
We recommend getting at least 3 quotes from qualified installers before making a decision. Check reviews, ask for local references, and make sure warranties are clearly stated in writing.
What to check before hiring an installer in Norwich
- Qualifications — check the installer holds relevant qualifications and certifications for solar panels before signing any contract
- Local references — ask for completed jobs in Norwich or Norfolk
- Reviews — check online reviews before committing
- Warranty — product and workmanship warranties should be clearly stated in writing
- 3 quotes minimum — we recommend comparing at least three quotes to ensure you get a fair price

Questions about solar panels in Norwich
How much do solar panels cost in Norwich?
How many solar panel installations are there in Norwich?
Is there a grant for solar panels in Norwich?
Solar panels in Norwich qualify for 0% VAT until March 2027. In Great Britain, the Smart Export Guarantee pays for surplus electricity you export to the grid, at a rate each supplier sets.
How long is the payback period in Norwich?
Do I need planning permission in Norwich?
How do I find a good installer in Norwich?
Get quotes for your roof in Norwich
Up to three approved installers who cover Norwich may contact you. Free, no obligation.
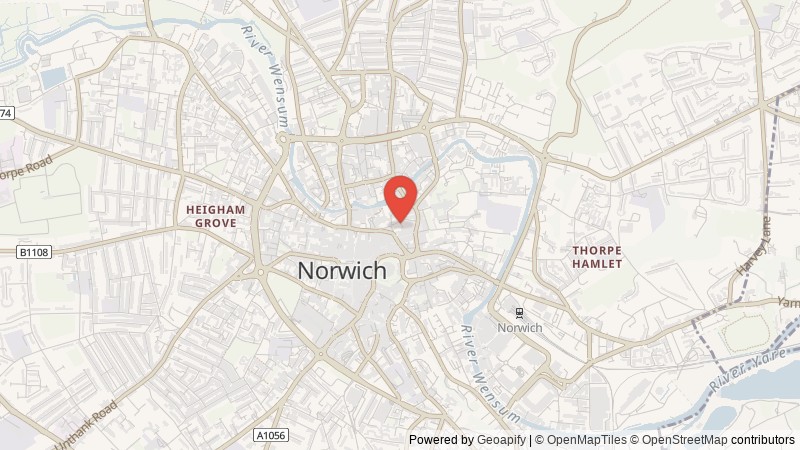
Norwich on the map
Solar Panels in nearby towns
Last reviewed: . Costs are modelled estimates from the Home Energy Quotes Cost Index — see how we calculate them. Grant rates are checked against GOV.UK.